How a Fatigue Risk Index turns tired drivers into a number you can act on
 Tom Halloran, Product · 13 November 2025 · 6 min read
Fatigue is the hardest fleet risk to manage for one frustrating reason: it is invisible right up until the moment it isn't. A speeding event has a number. A harsh-brake has a force. Fatigue has a yawn, a slow blink, a drifting lane, signs that are obvious in hindsight and almost impossible to act on in advance.
And it is common. A large naturalistic study by the AAA Foundation found drowsiness present in 8.8% to 9.5% of all crashes, roughly eight times the rate that shows up in police reports (AAA Foundation, 2018). NHTSA attributes around 795 deaths and 50,000 injuries a year to drowsy driving, and calls even those figures underestimates (NHTSA).
A compliant logbook does not help here. Hours-of-service rules prove a driver was legal to drive. They say nothing about whether the driver is awake, because the same eleven hours hit very differently at 2pm and 2am.
From scattered signals to one index
The idea behind a Fatigue Risk Index is simple: stop treating fatigue as a series of disconnected alarms and start treating it as a measurable state that rises and falls. FleetScout blends three inputs into a single 0–100 score:
- Fatigue event rate: eye-closure, yawning, microsleep and distraction events from the cab-facing camera, normalized by distance and hours so a long shift isn't unfairly penalised.
- Circadian exposure: when the driving actually happens. Time in the 02:00–05:00 window carries more weight, because that is when the body's drive to sleep peaks.
- Trend: whether the driver or shift is getting worse or better over recent days.
The output is a number, banded low, moderate or high, that you can rank, escalate on, and track over time, instead of a folder of clips nobody has time to watch.
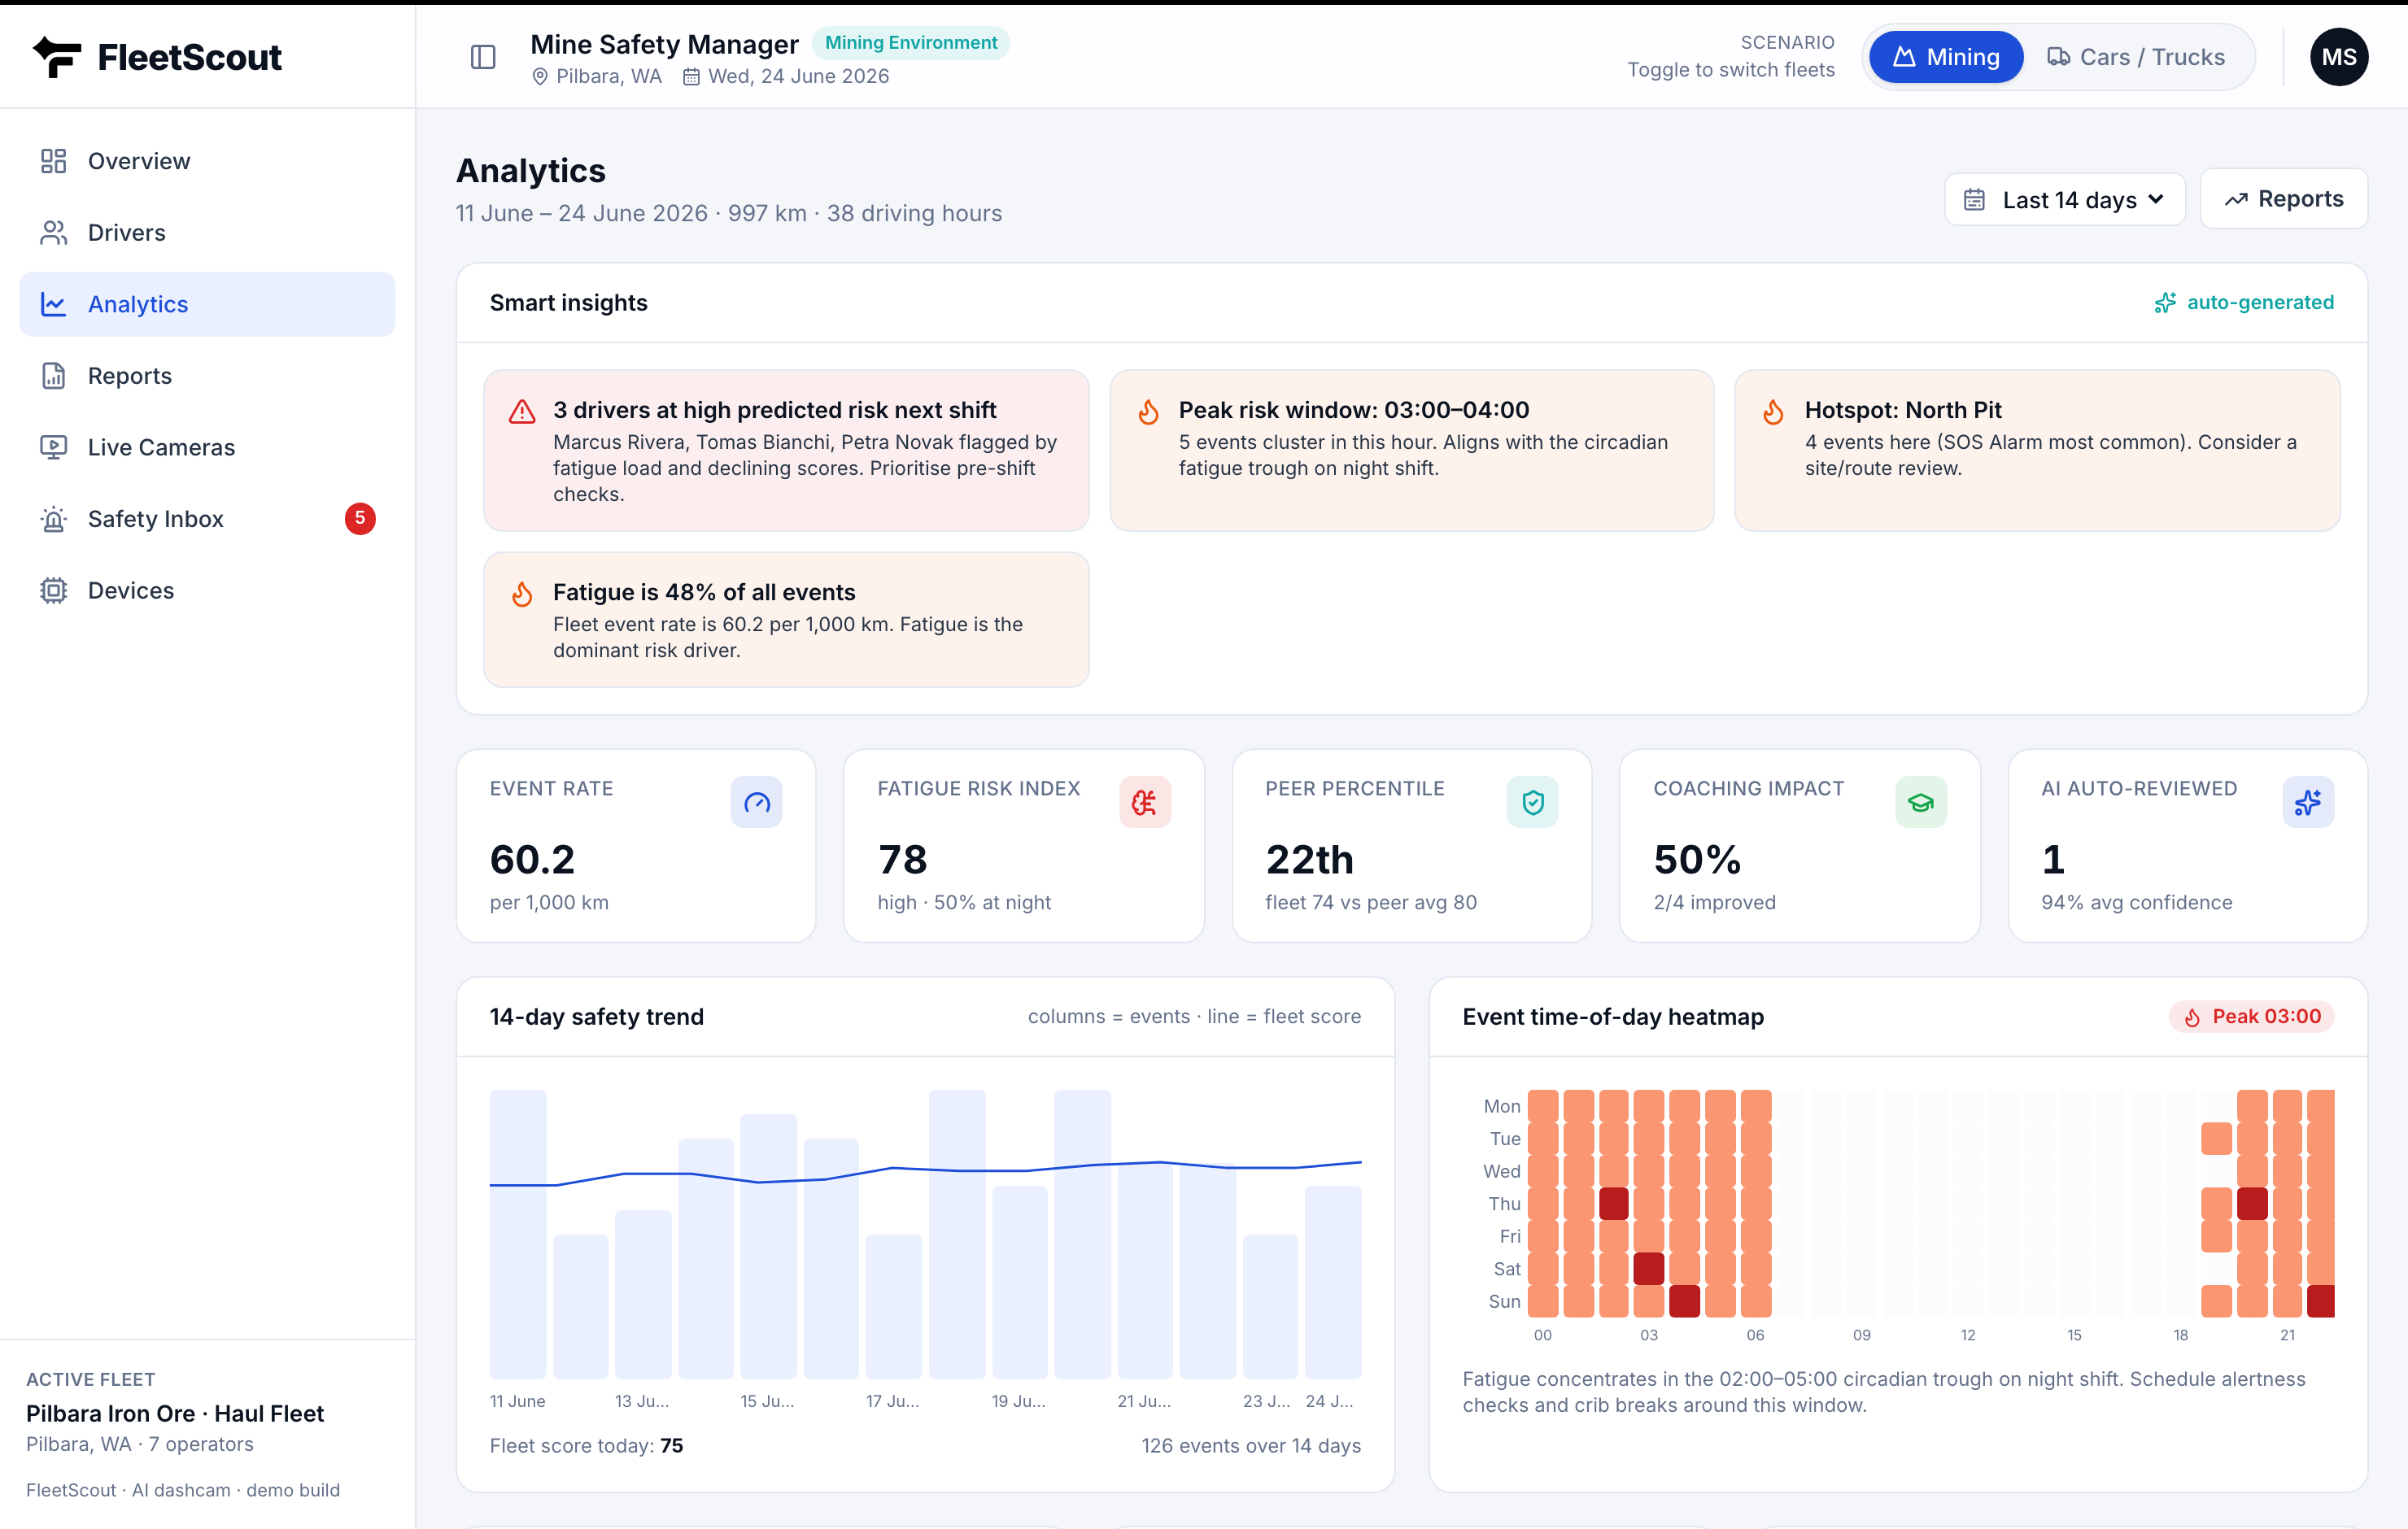
The Fatigue Risk Index, live on Analytics
The index sits on the Analytics page alongside the time-of-day heatmap and a per-driver next-shift forecast, so a supervisor can see not just who is fatigued but when the fleet is most exposed.
A real shift, scored
Picture a night-shift haul-truck operator. For the first half of the shift the index sits "moderate." Around 2am the camera logs two short eye-closures and a yawn within twenty minutes, and the trend ticks up. The index crosses into "high" before a microsleep, not after. The control room gets the flag and makes a thirty-second radio check and brings the crib break forward. Nothing happens, which is exactly the point.
The goal isn't to record the microsleep. It's to make the radio call ten minutes before it.
Fatigue will never be fully rostered away. But once it is a number, it stops being a feeling people argue about and becomes a risk you can rank, escalate and prove you acted on.
Sources
- AAA Foundation for Traffic Safety, drowsy-driving prevalence (SHRP 2), 2018. aaafoundation.org
- NHTSA, Drowsy Driving. nhtsa.gov
Score fatigue before it reaches the ramp
Open the control panel and switch to the mining scenario to see the Fatigue Risk Index in action.
Open Control Panel