Why counting events is unfair: the case for exposure-normalized scores
 Tom Halloran, Product · 14 May 2026 · 5 min read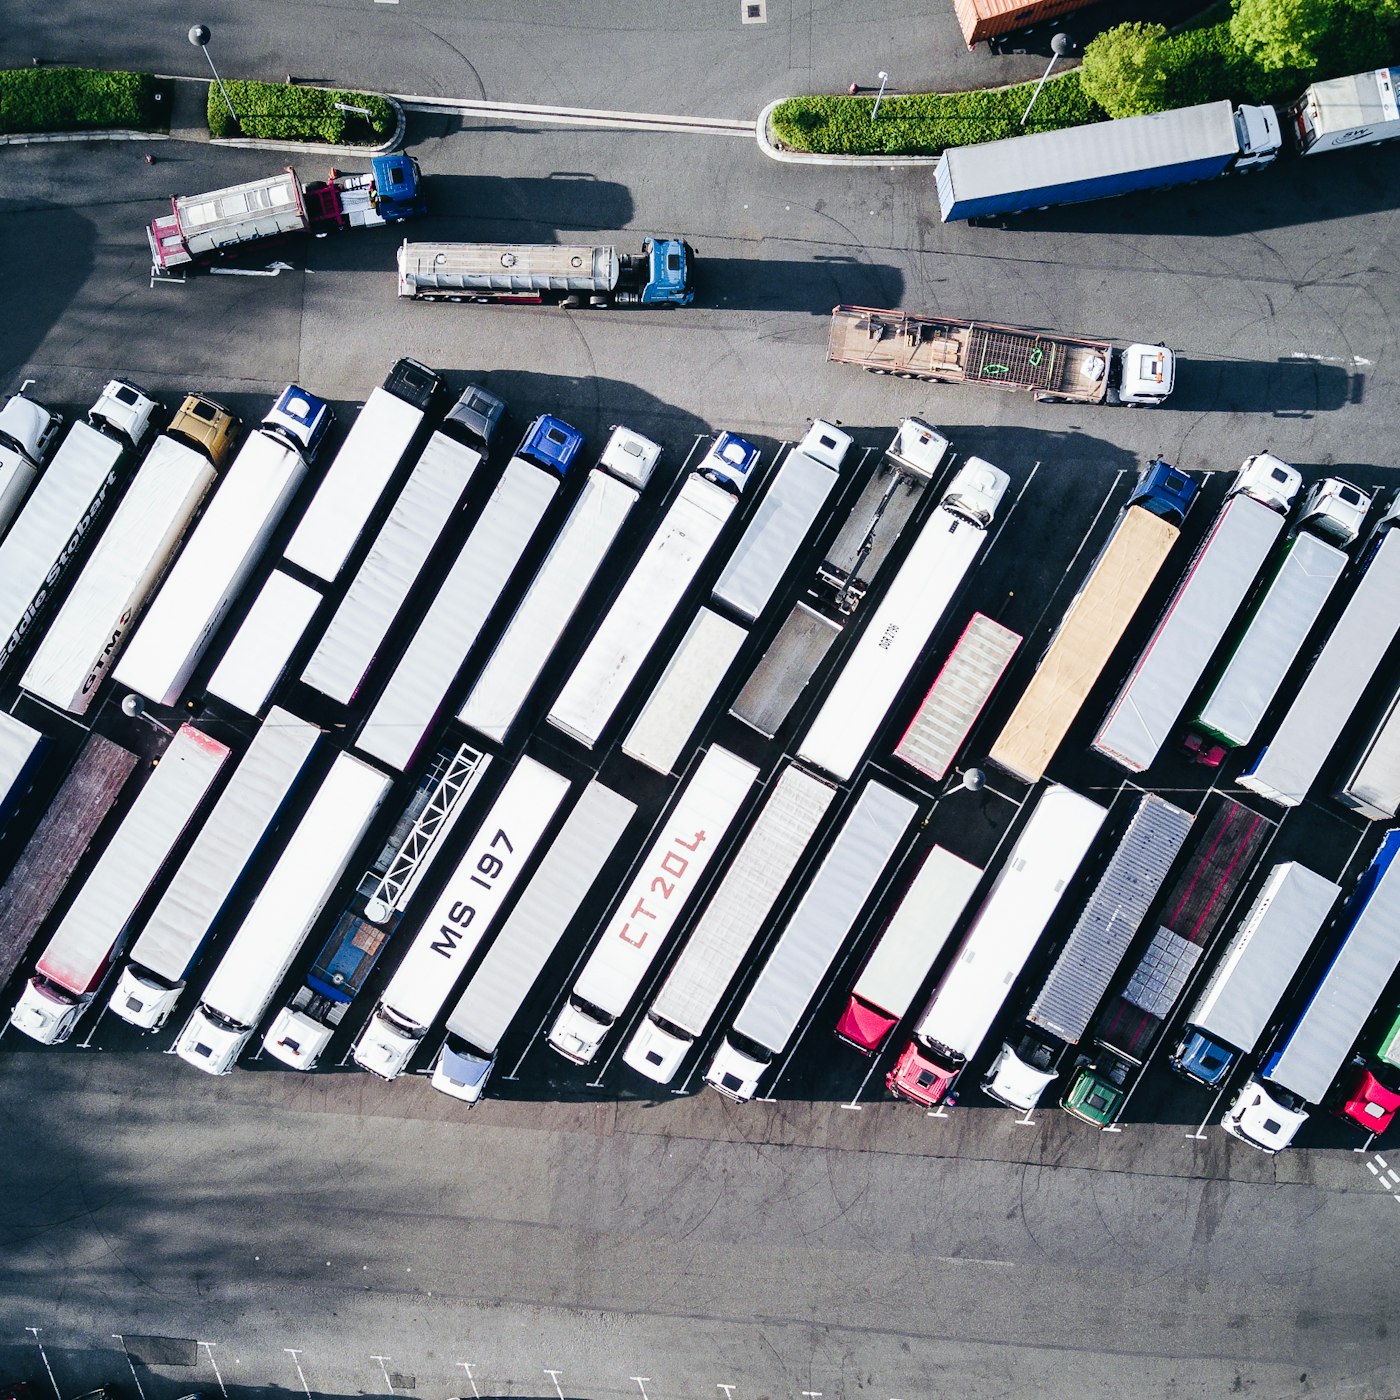
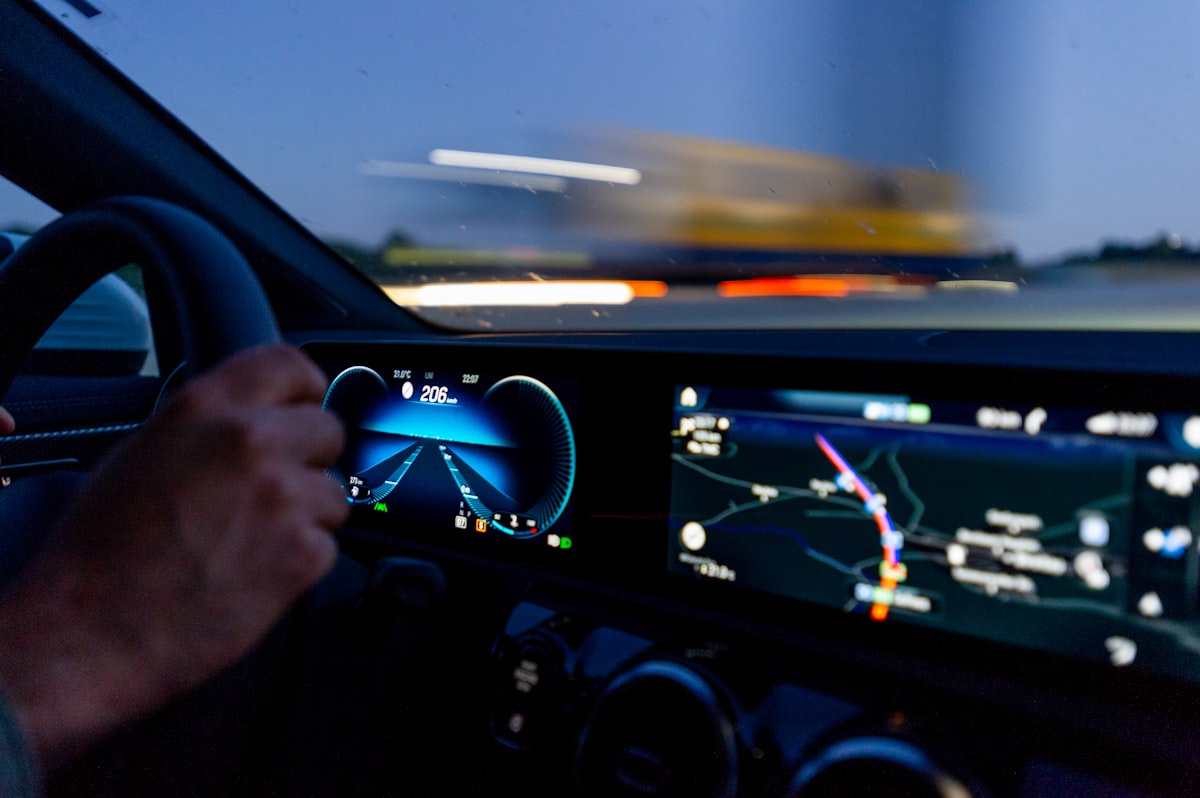
Here is the fastest way to lose your drivers' trust in a safety program: rank them by raw event counts. Do that, and your "worst" driver every month will be whoever drove the most kilometres, because more exposure means more chances for an event, regardless of how carefully they drove. The driver knows it is unfair. They stop believing the score. The program dies.
Ten events in 500 km and ten in 5,000 km are not the same driver. A fair score has to know the difference.
Normalize by exposure
The fix is the same one every serious safety field uses: measure rate, not count. Aviation tracks incidents per flight hour. Occupational safety tracks per 200,000 hours worked. Fleet safety should track events per distance and per shift-hour, so a long-haul driver and a short-route van are judged on the same footing. FleetScout scores every driver on:
- Events per 1,000 km: the distance-normalized rate, so high-mileage drivers aren't punished for being productive.
- Events per shift-hour: the exposure measure that matters most in mining, where "distance" is laps of a pit, not motorway miles.
Those rates roll up cleanly: each drive is scored, the driver's score is a recency-weighted roll-up of their drives, and the fleet score is the roll-up of drivers. One method, three altitudes.
The driver scorecard
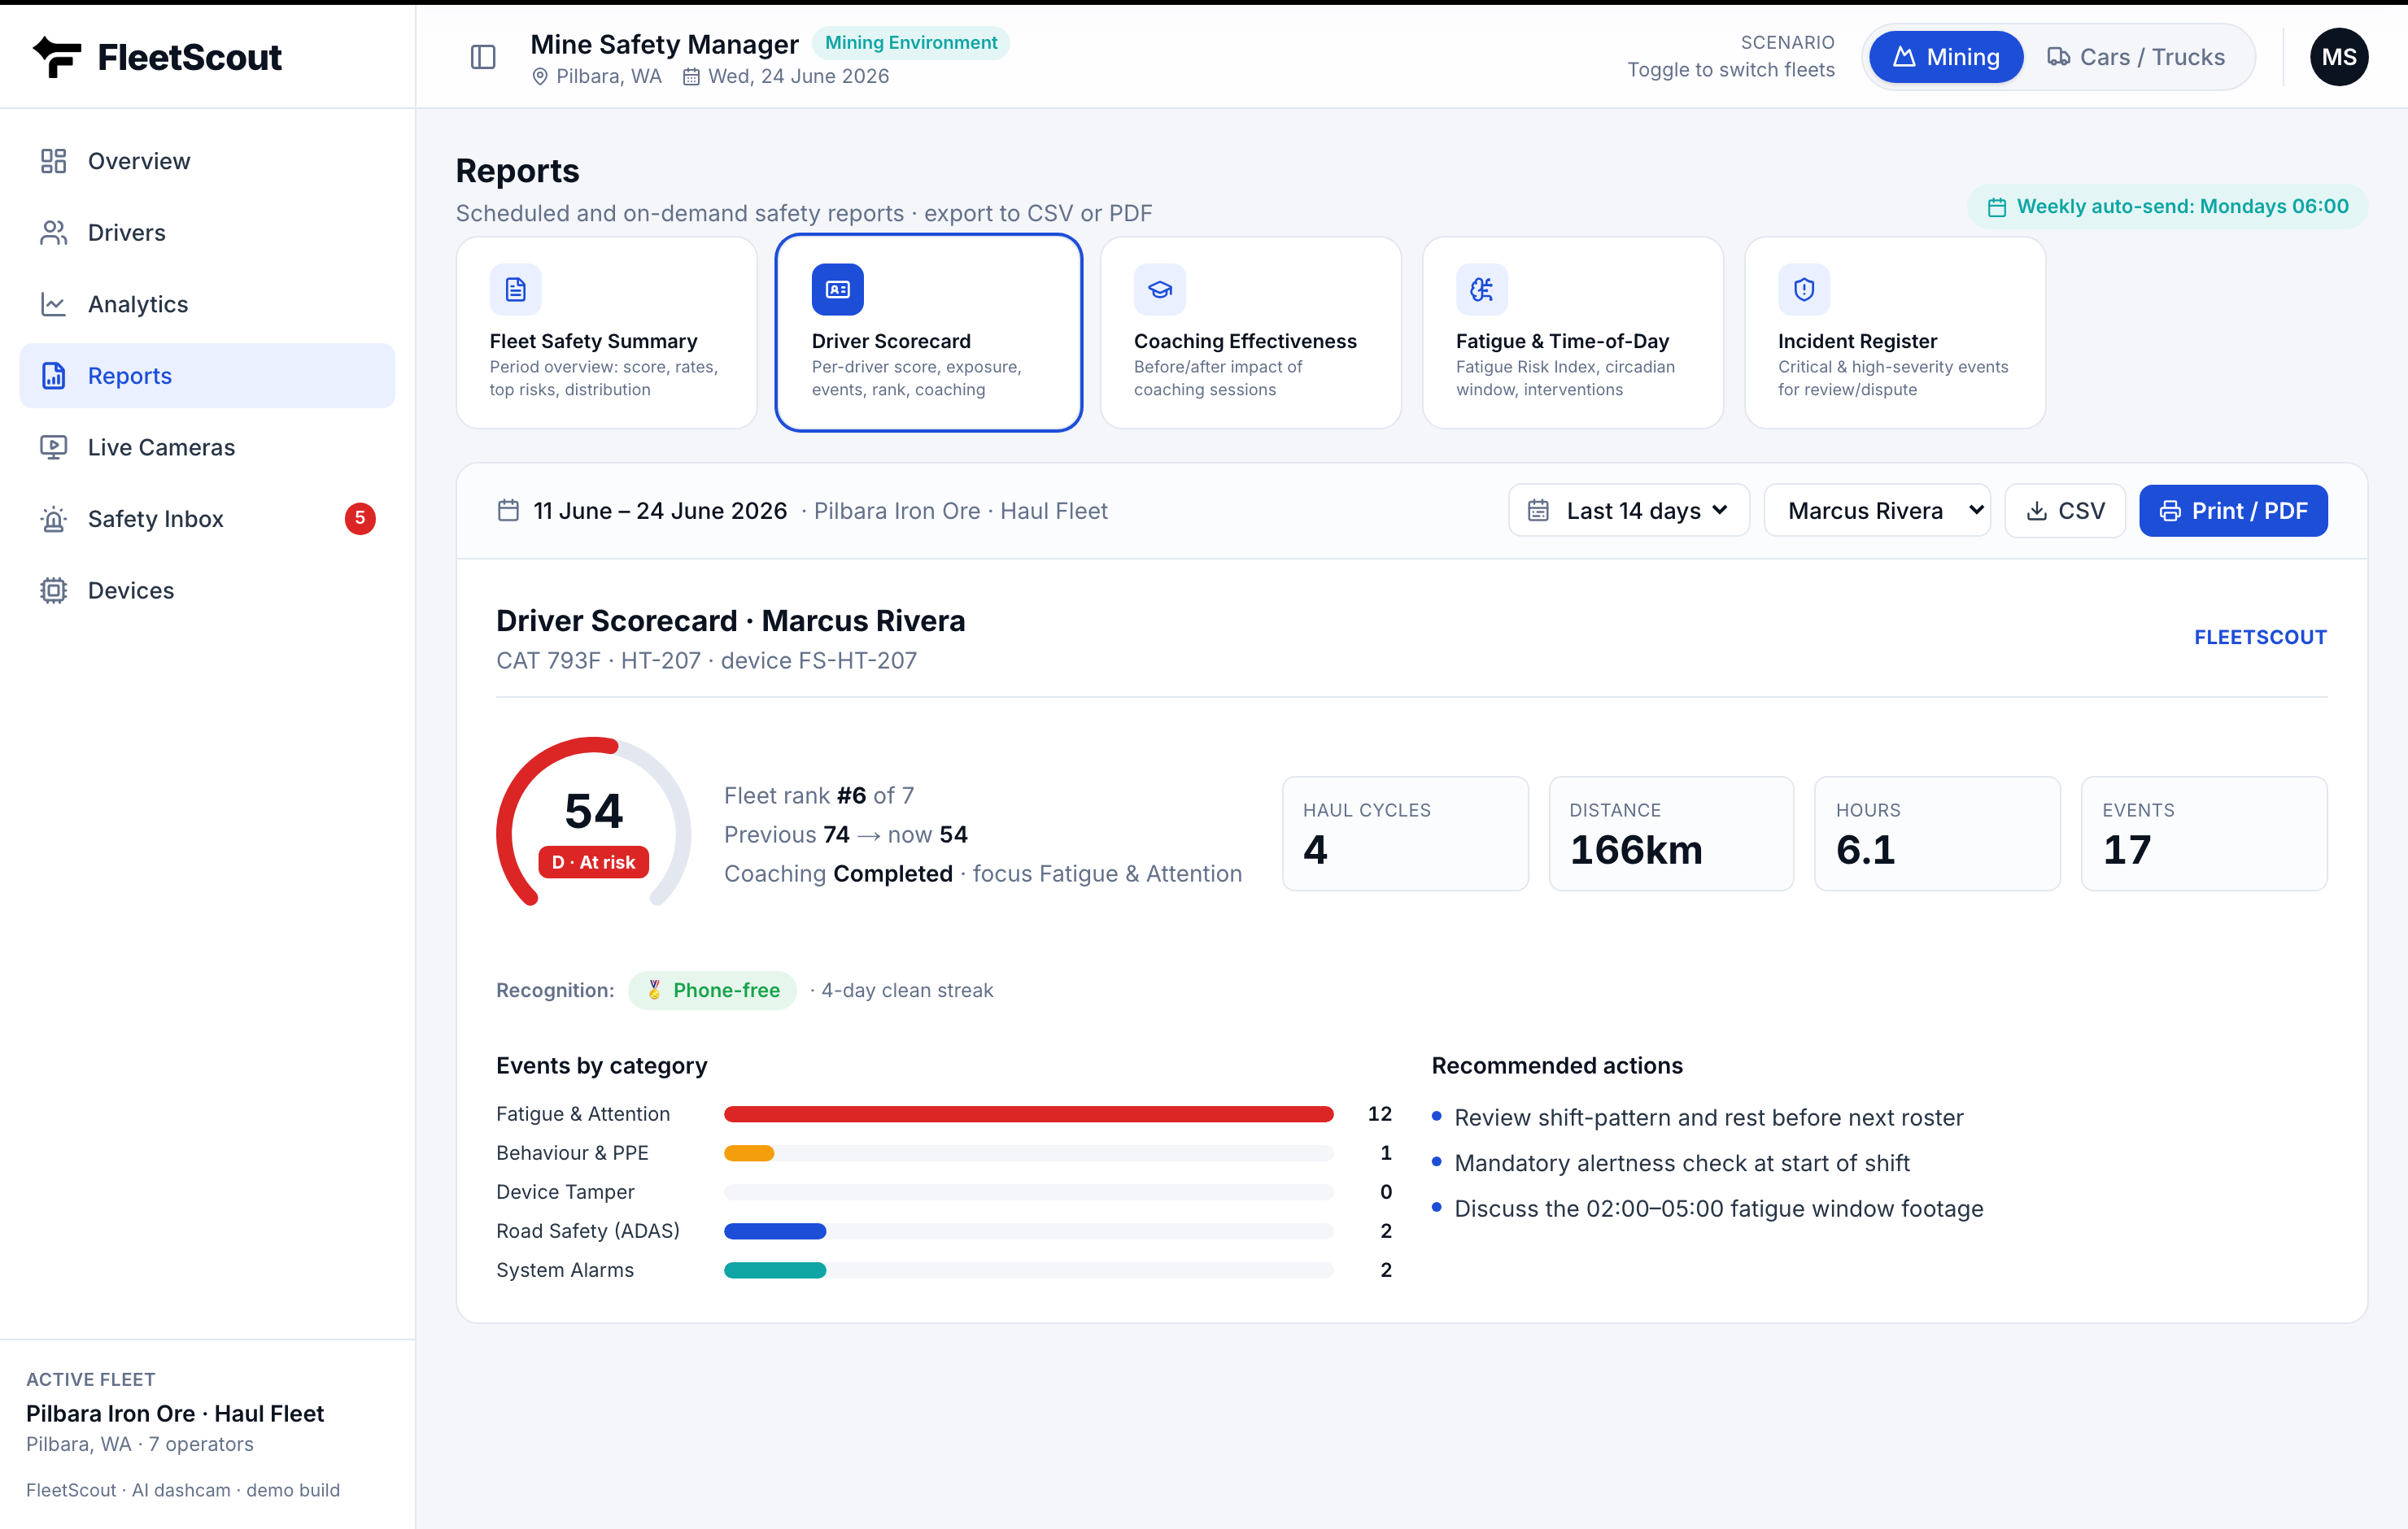
Every driver gets an exportable scorecard: an overarching KPI, their rank in the fleet, the per-1,000 km rate, an event breakdown by category, recognition badges, and the specific coaching actions that follow.
Why fairness is not just nice, it's effective
A fair score is not a morale nicety, it is what makes the coaching land. The evidence that video-plus-coaching works, roughly a 55–60% drop in safety events in an FMCSA field test (FMCSA / VTTI), assumes the driver accepts the feedback. A driver who believes the ranking is rigged against high-mileage routes will tune out the coaching, and you lose the benefit. Normalize the score and the conversation changes from "you're being watched" to "here's where you genuinely sit, and here's the one thing to work on."
There is a bonus: exposure-normalized scoring also surfaces the real outliers. The short-route van with a high rate per kilometre, the driver everyone assumed was fine because their raw count was low, becomes visible. Counting events hides your worst risk behind your busiest driver. Measuring rate puts the right name at the top of the list.
Sources
- FMCSA / VTTI, Onboard Monitoring System field test. rosap.ntl.bts.gov
Rank your fleet fairly
See exposure-normalized scores and exportable driver scorecards in the control panel.
Open Control Panel