Reading the heatmap: when your fleet is most at risk, by the hour
 Tom Halloran, Product · 11 March 2026 · 5 min read
Most safety dashboards answer "who" and "what." Who had the most events, what kind they were. Far fewer answer the question that actually drives a roster decision: when. And risk, it turns out, is anything but evenly spread across the clock.
The pattern is strongest where fatigue dominates. In mining haulage, injuries pile up later in the shift, one peer-reviewed review found 9.6% of mining injuries occur after the ninth hour on shift, and the deepest danger sits in the pre-dawn circadian trough (Friedman, 2022). On the road, the shape is different but just as real: a post-lunch dip, the back end of long single legs, the first dark hour of an early start.
A grid that points at a decision
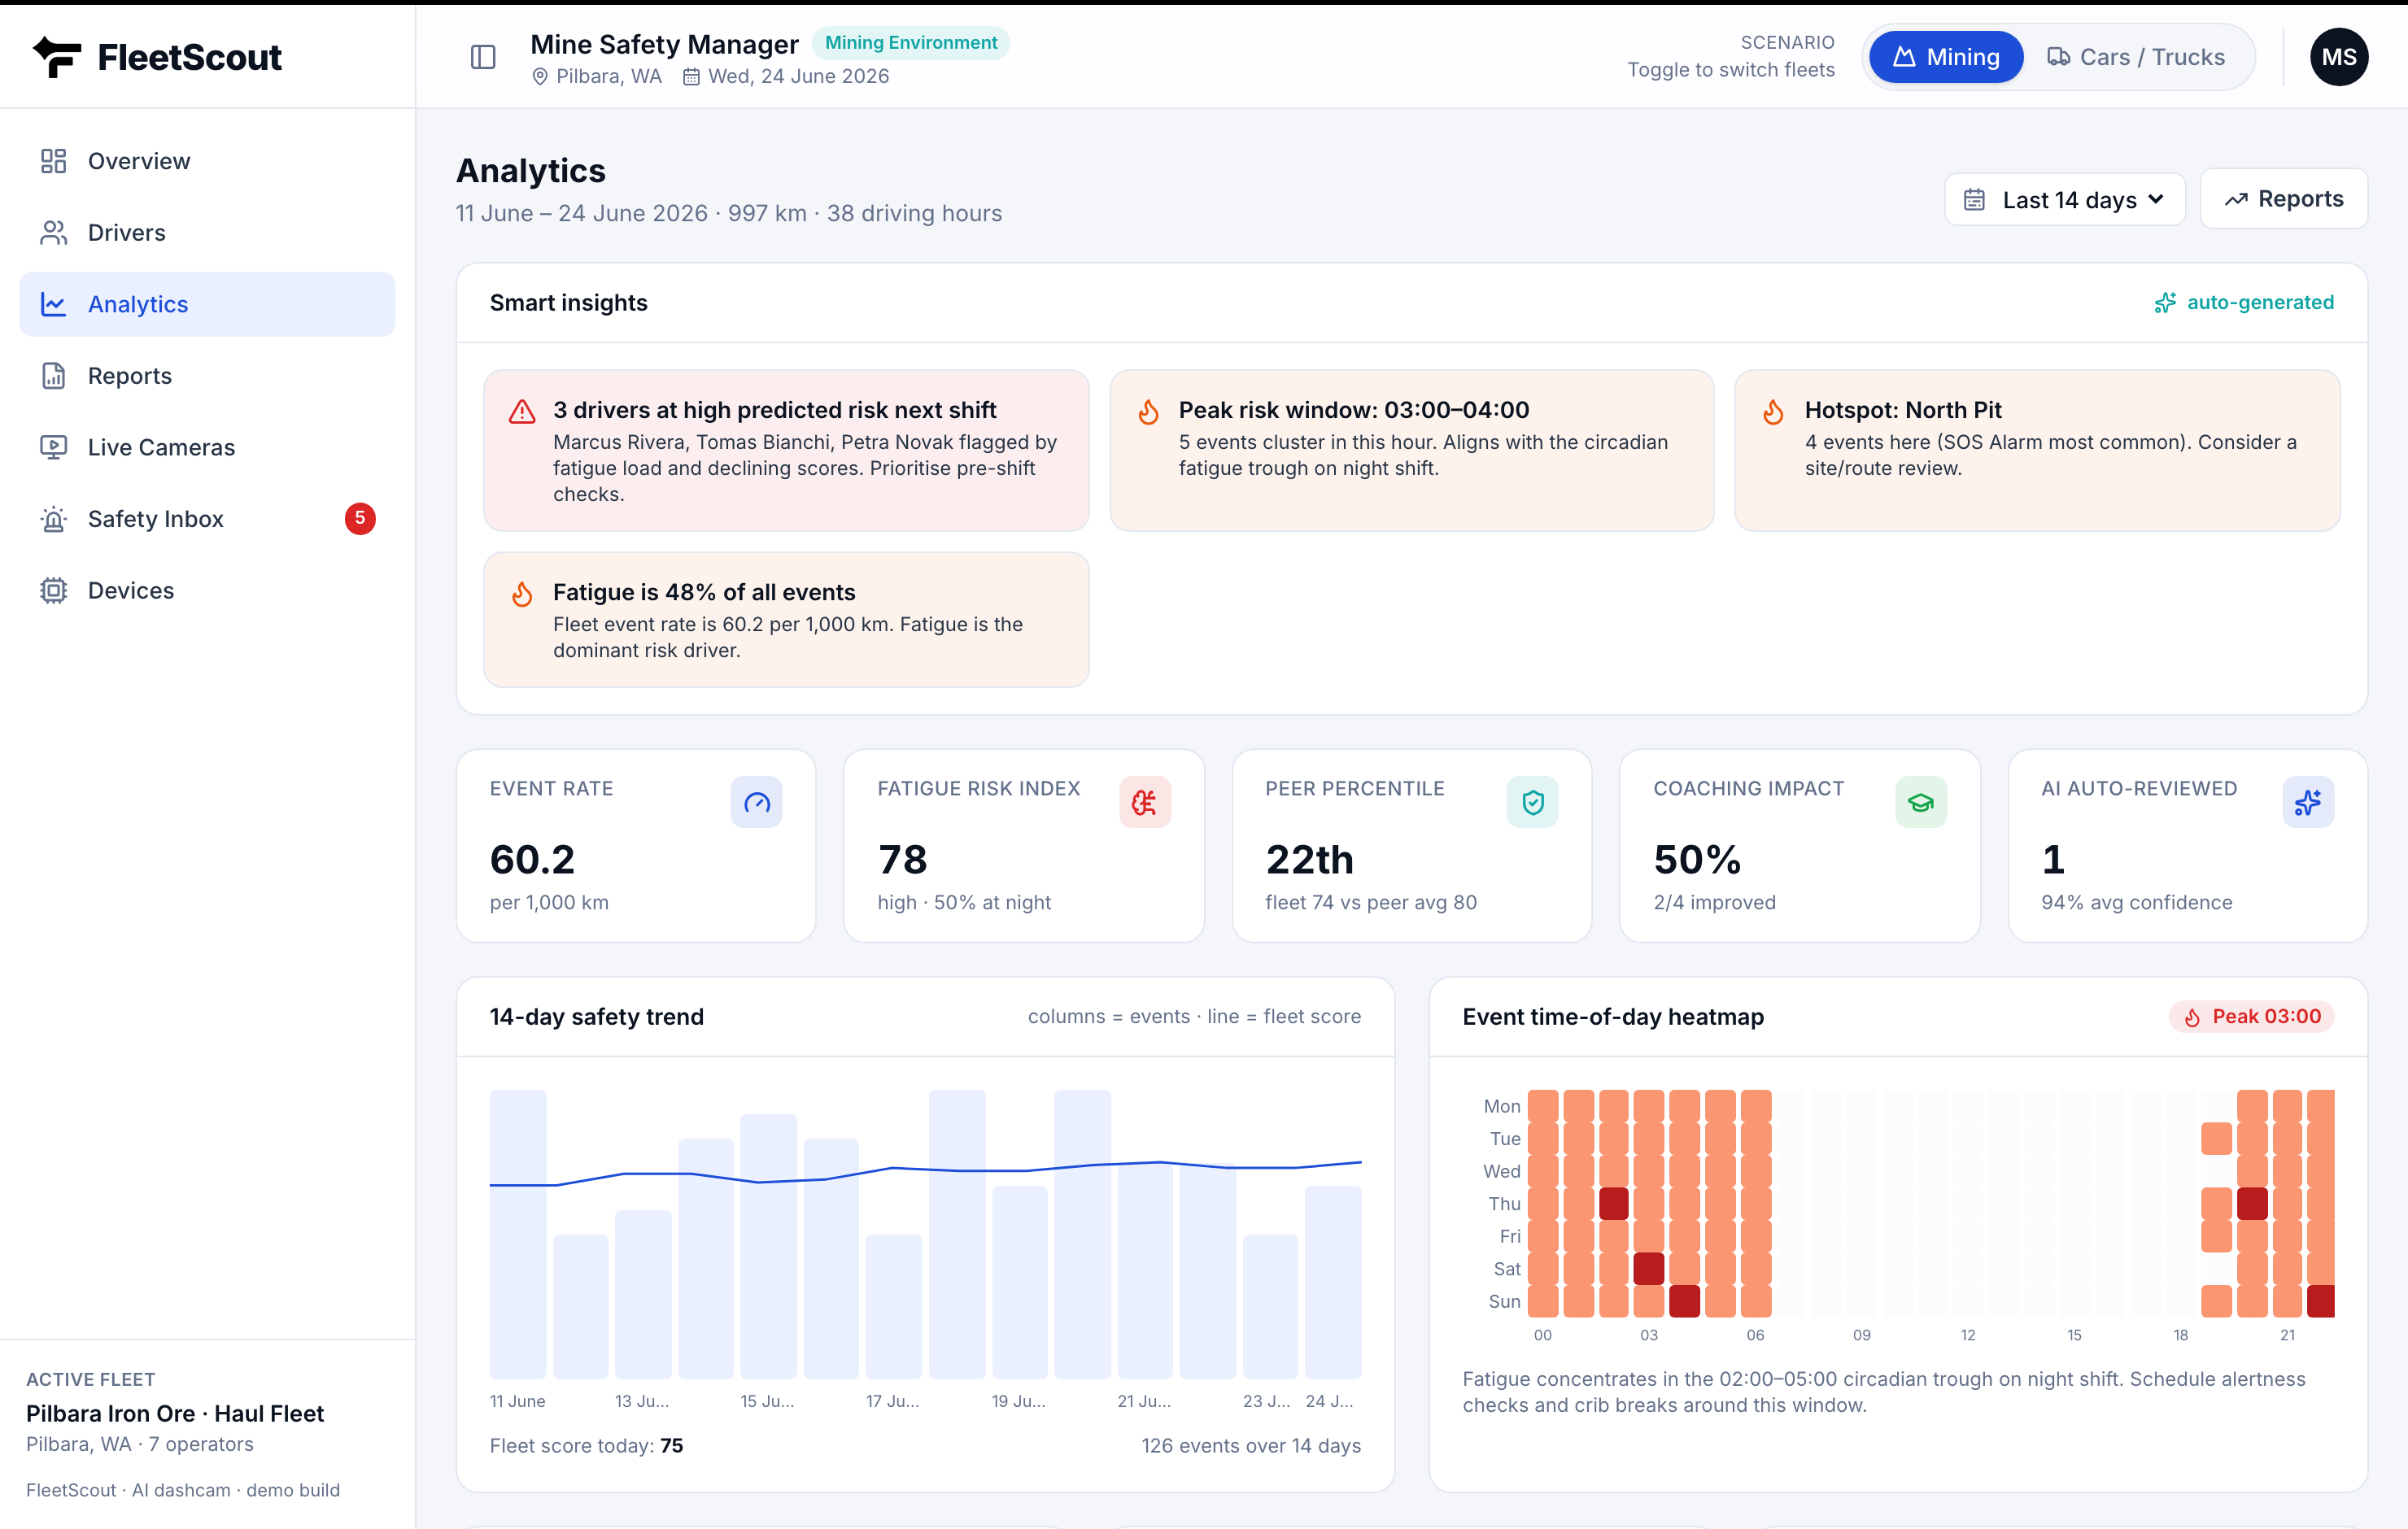
A time-of-day heatmap plots every safety event across a grid of hour-of-day by day-of-week. Cells glow where events concentrate. What you get is not another number to admire, it is a map of when to put your limited attention, your supervisors, your breaks and your coaching.
The fatigue window, visualized
FleetScout's heatmap sits on the Analytics page and adapts to context. In the mining scenario it lights up the 02:00–05:00 trough on night shift, in logistics it surfaces the daytime attention dips, and a callout names the single peak hour.
From insight to roster
The value of the heatmap is that it converts directly into action:
- Staff the peak. If events cluster at 3am, that is when a supervisor should be reachable and an alertness check should land, not at the start of shift when everyone is fresh.
- Move the break. Bring the crib break or rest stop forward to just before the danger window, not after it.
- Time the coaching. A driver coached about a 2am drift remembers it differently than one coached about "events in general."
- Check your rosters. A recurring Friday-night spike is a scheduling problem, not a driver problem.
Knowing your fleet's most dangerous hour is worth more than knowing its most dangerous driver, because you can move the hour.
No competitor leads with a time-of-day view, and we think that is a miss. The clock is one of the most powerful predictors of risk you have, and it is sitting in your event data already, waiting to be read.
Sources
- Friedman, mining haulage fatigue review, 2022. PMC9018855
See your fleet's most dangerous hour
The time-of-day heatmap is live on the Analytics page, in both mining and logistics scenarios.
Open Control Panel